2015 PPAI Distributor Sales Volume Report
For the first time, large company sales revenues made the difference between a flat year and a record-breaking one—at nearly $21 billion.
It was the best of times for some, it was the worst of times for others. Then again, maybe that’s too extreme on both ends of the spectrum. While there were both huge gains and lackluster sales among industry companies in 2015, in general it was a year of average positive growth for promotional product distributors. It was also a year in which the gap between small and large distributors widened enough to change the balance between both groups in the total sales volume figures for the industry. Overall, 2015 was the year of the large distributor.
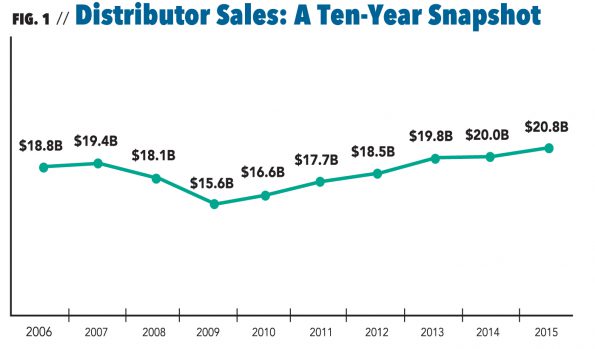
Total industry sales by distributors increased by 3.82 percent to nearly $21 billion ($20,808,170,722)—breaking the record set in 2014.
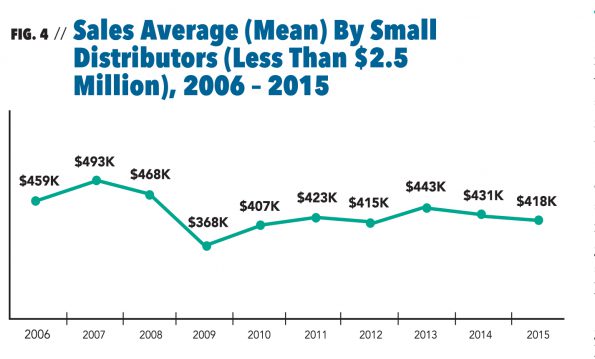
While sales continued the upward trend started in 2009, the net positive result is due solely to a significant increase in revenue among large distributor companies. In contrast, small distributors’ revenue declined further compared to 2014. Small distributors, those with sales of less than $2.5 million, experienced a 6.63-percent decline over 2014, while larger companies saw a 14.05-percent increase.
The other big news in 2015 is that promotional products’ percentage of growth was greater than any other traditional advertising media (see chart below), except for broadcast TV at four percent and billboards at 4.3 percent. With a growth rate of 3.82 percent over 2014 sales, promotional products beat out direct mail at three percent growth, consumer magazines at two percent, business magazines, which were flat, and radio, which plummeted by 18.2 percent. However, it’s interesting to note that print advertising shows signs of stabilizing with business magazines remaining steady year over year, consumer magazine revenue actually growing last year and newspapers down only three percent compared to -3.5 percent in 2014.
“The results of the 2015 Annual Distributor Sales Report reflect year-over-year growth for the promotional products industry in a relatively flat year for non-digital advertising in general,” says Paul Bellantone, CAE, president and CEO of PPAI. “Our growth speaks to the power and effectiveness of promotional products as a stand-alone marketing tool as well as part of integrated campaigns where building strong customer relationships is key. While many of our larger distributor respondents fared best with significant double-digit growth, segments of the small distributor community were flat and down year over year. I think these results are reflective of the investments companies will continue to make to deliver an omni-channel approach to serving the marketplace. Overall, I am pleased to see our industry continue to show its strength and value in an uncertain economy.”
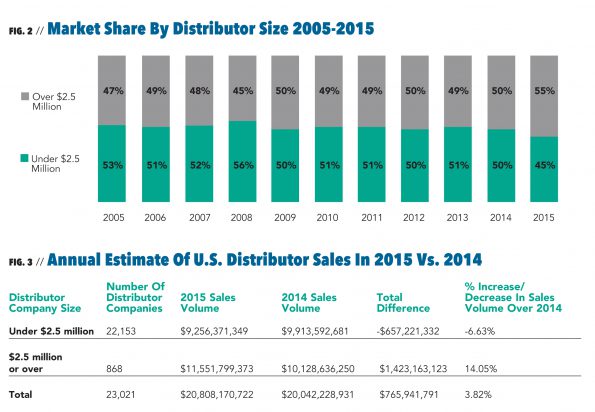
The prediction in recent years that large companies would keep getting bigger and small companies would decline gained more of a toehold in 2015. The overall number of companies with sales less than $2.5 million that report promotional products sales declined to 22,153 from 23,025 in 2014. However, the number of large companies with sales of more than $2.5 million reporting sales remained relatively stable at 868 compared to 872 in 2014. In addition, the total number of U.S. distributor companies reporting sales in 2015 was 23,021, slightly down from 23,896 in 2014.
In terms of market share, the 868 firms representing large companies (sales of $2.5 million or more) captured $11,551,799,373 of the business—a 55.5-percent share. It should be noted that the large-company grouping included franchisors like Adventures in Advertising, Proforma and iPROMOTEu, and these firms report for their franchisees. Sales for the smaller distributors as a group amounted to $9,256,371,349, or 44.5 percent.
For the first time in many years, large distributors accounted for a larger proportion of the total sales volume than smaller firms, carving out five additional percentage points of the total sales performance.
As in 2014, only large companies had positive results by year-end. Distributors in the $2.5 million-plus bracket recorded sales of $11.5 billion, showing significant gains at a 14.05 percent increase over 2014. On the contrary, the smaller-company segment saw a greater decline of -6.63 percent, with total orders of approximately $9.3 billion.
A look by sub-segment reveals that most of the small-company categories saw a decrease in sales in 2015. The only sub-segment that experienced positive growth included companies with sales of $500,000 to $1 million (16.07 percent). Companies with sales of more than $1 million to $2.5 million had the biggest decline in sales among all sub-segments at -20.50 percent.
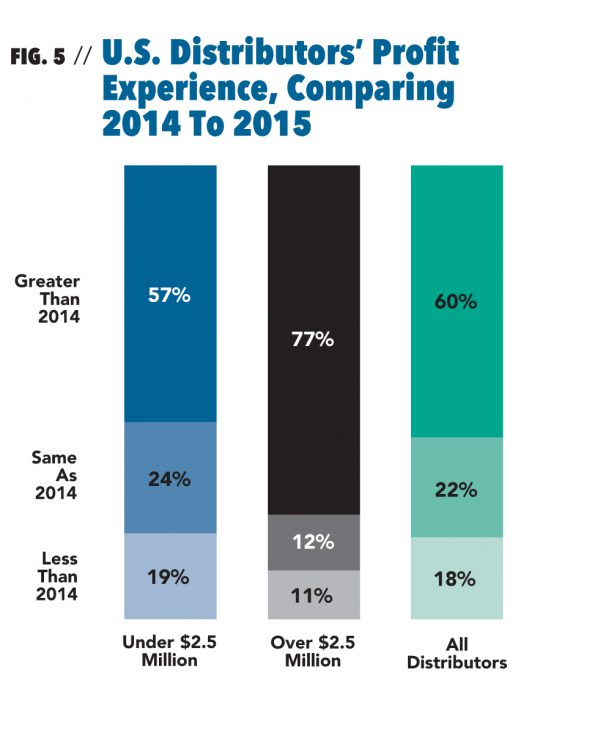
What About Profits?
Much like 2014, nearly 60 percent (57 percent) of all distributors saw greater profits over the previous year, but large distributors saw the biggest wins in profits. In this group, 78 percent indicated they enjoyed higher profits in 2015, compared to 62 percent in 2014, while only 57 percent of the small distributors did so, remaining at the same level as 2014 (57 percent in 2014). One in five small distributors saw lower profit levels than in 2014, while a quarter experienced the same profit level.
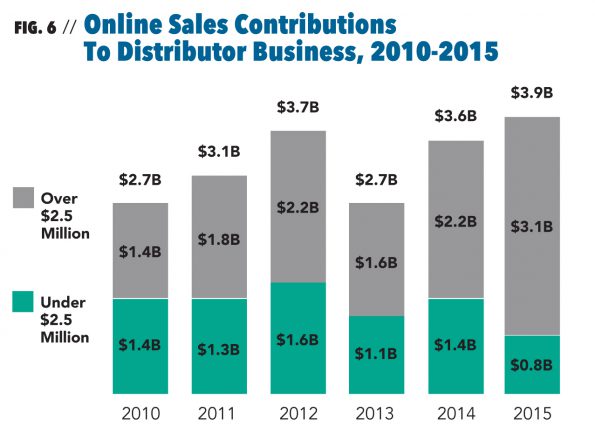
The Continued Rise Of Online Sales
Online sales are defined as buys resulting from orders placed through an online store or website. Web sales (not to be confused with salespeople transmitting orders online) are estimated to be $3,944,881,904, or 19 percent of the industry total sales.
This category of promotional products sales continued to grow, representing 19 percent of the sales volume in 2015, up two percentage points from 17.9 percent in 2014. Total online sales grew by 10 percent over 2014 to $3,944,881,904, solely due to an increase in online sales among large distributors.
However, compared to 2014, the rate of growth in online sales slowed down significantly in 2015, mainly due to a significant decline in online sales by small distributors (-39.5 percent).
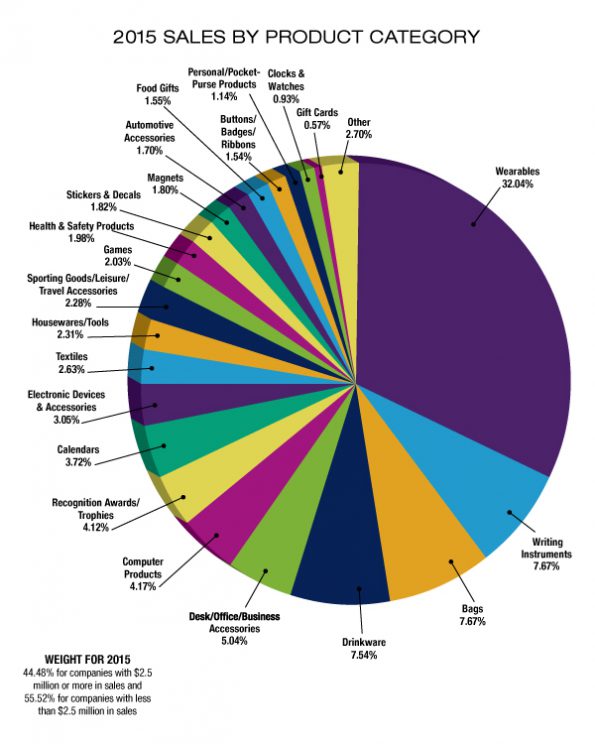
2015 Sales By Products And Programs
T-shirts, golf shirts, aprons, uniforms, caps, jackets, neckwear and footwear continued to be the biggest category of promotional products from a sales point of view with total wearables sales up again last year over 2014, capturing 32 percent of the market.
Historically, the second, third and fourth best-selling categories jockey for position every year with writing instruments and bags tying for the second spot with 7.67 percent of sales each in 2015, followed by drinkware at 7.54 percent, desk and office at five percent and the remaining product categories following at a strong pace.
In 2015, sales in almost every product category rose slightly with some of the biggest gains in desk and office products and sporting goods, leisure and travel accessories.
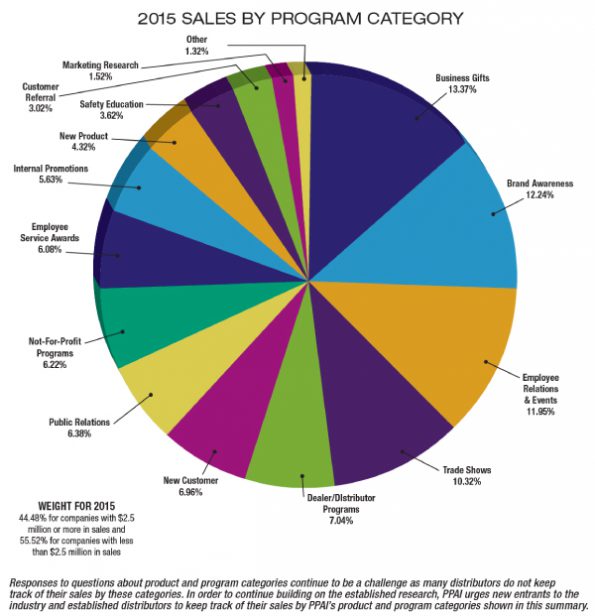
In sales by program category, the big winner in 2015 was business gifts at 13.37 percent followed by brand awareness at 12.24 percent, which held the lead in 2014 at 14.43 percent. Employee relations and events rose last year to 11.95 percent of sales, a 2.27-percent increase over 2014. In addition to business gifts, sales for public relations programs was the big gainer in 2015, rising from just under five percent to 6.38 percent.
Inside The Research
PPAI’s 2015 Annual Distributor Sales Summary resulted from an independent email/mail survey of industry distributors (including both PPAI members and nonmembers) conducted during March – April 2016, by Relevant Insights LLC, an independent market research firm. In addition, a census of the largest firms was also undertaken. Combining the samples from the different data collection methods used resulted in a total of 23,021 (22,153 small firms and 868 large firms) distributor surveys covering the entire U.S. industry. Responses projected across the entire distributor population combine sales for small distributors (under $2.5 million) and large distributor firms (over $2.5 million) to determine the total promotional products dollar volume.
The full report, containing 41 years of historical data, sales by company size and more predictions for 2016, is free to PPAI members at www.ppai.org. Click on Inside PPAI and then on Research.
Michaela Mora is principal of Relevant Insights, LLC. Tina Berres Filipski is editor of PPB.

