
(Editor’s Note: Since 1965, PPAI’s Distributor Sales Volume Estimate has been the most trusted, directionally accurate measure of the size of the U.S. promotional products market and trends in the industry. Selected charts displayed in this article are taken from the full report, available to members at PPAI’s Professional membership tiers – Silver, Gold and Platinum.)
U.S. distributor sales reached $26.8 billion last year, according to the just-released 2024 Distributor Sales Volume Estimate.
The latest version of PPAI’s long-running study shows another year of only modest growth for the industry as it continued to navigate macroeconomic headwinds, such as supply chain disruptions and high interest rates. While 2024’s growth rate of 2.63% was slightly higher than 2023’s rate of 2.24%, it still failed to outpace 2024’s annual inflation rate of 2.9%, according to the Consumer Price Index report.
Looking ahead to 2025, U.S. distributors are optimistic. Nearly two-thirds (65%) expect sales growth, especially large distributors. More than half of U.S. distributors are also expecting higher profits, suggesting they’re adapting strategies to capitalize on market opportunities and optimize margins.
Of course, that optimism should be tempered due to the expansion of tariffs on imports, inflation and overall economic uncertainty.
“The promo industry grew 2.63% in 2024, reaching $26.78 billion, despite economic pressures and ongoing tariff uncertainty,” says Alok Bhat, market economist, research and public affairs lead for PPAI. “Distributors are adapting through digital expansion, sustainability and diversified sourcing. While challenges remain, 65% expect sales growth in 2025, signaling strong industry resilience.”

Alok Bhat
Market Economist, Research & Public Affairs Lead, PPAI
The Sales Volume Estimate also tracks the measured progression of several promo industry trends over the past year. These include larger distributors’ capture of a slightly bigger share of sales than they did in 2023, and the continued rise in prominence of sustainable products in the sector.
For 60 years, PPAI has been collecting, analyzing and reporting U.S. distributor sales. This annual study, prepared by independent research firm Relevant Insights, is the most definitive and comprehensive of its kind in the industry. It’s a valuable resource for understanding the current landscape for promotional products companies and as a potential tool in any attempt to try to prepare for the future.
Key Findings
As previously mentioned, the promo industry saw growth of 2.63% in 2024. Although down drastically from 2022’s growth rate of 15.6% and 2021’s growth rate of 12.5% – which were recovery periods from 2020’s pandemic loss – this is slightly higher than 2023’s 2.24% growth.
This growth boosted total industry sales to $26.78 billion, up slightly from 2023’s $26.09 billion in sales.

A notable trend this year is the rise of non-industry suppliers.
“Distributors are increasingly diversifying their sourcing strategies, with $4.3 billion (16% of total sales) coming from outside traditional networks,” Bhat says. “Distributors are leveraging a wider range of sourcing options to meet evolving client needs.”
Company Size Comparisons
Large U.S. distributors – classified as those with annual sales over $2.5 million – were responsible for 54% of the industry’s sales volume (see Figure 2). These distributors made $14.4 billion in 2024. Conversely, small distributors (under $2.5 million) accounted for 46% of the industry’s sales volumes, making $12.4 billion.

Both small and large distributors saw modest increases in their sales volumes compared to 2023, with growth rates of 2.49% and 2.75%, respectively (see Figure 3).

In terms of changes in sales volume, every group size of distributors saw a positive change in 2024. However, companies with sales between $1 million and $2.5 million had the greatest sales growth at +4.03%.
The average revenue for small distributors continued to grow, reaching $548,681 in 2024 compared to $524,722 in 2023 (see Figure 5). This increase indicates stable performance in this sector. The growth remains modest, reflecting consistent market conditions for small distributors.

Online Sales
In 2024, online sales – which are transactions made through online stores and distributor websites – totaled $6.83 billion. This accounts for 25.5% of total industry sales, up from $5.03 billion (19.3%) in 2023.
- Some 84% of large distributors and 60% of small distributors reported engaging in online sales, slightly up from those who reported using this avenue in 2023.
“The share of total industry sales is approaching pre-pandemic highs (25.7% in 2021), signaling sustained long-term digital adoption,” Bhat explains.
Sustainable Products Still A Key Player
Sales in the sustainable products category (items recognized for their eco-friendly attributes at various stages of their lifecycle) topped an estimated $3.69 billion in 2024, which reflects the appeal of their eco-friendly attributes across production, disposal and usage.
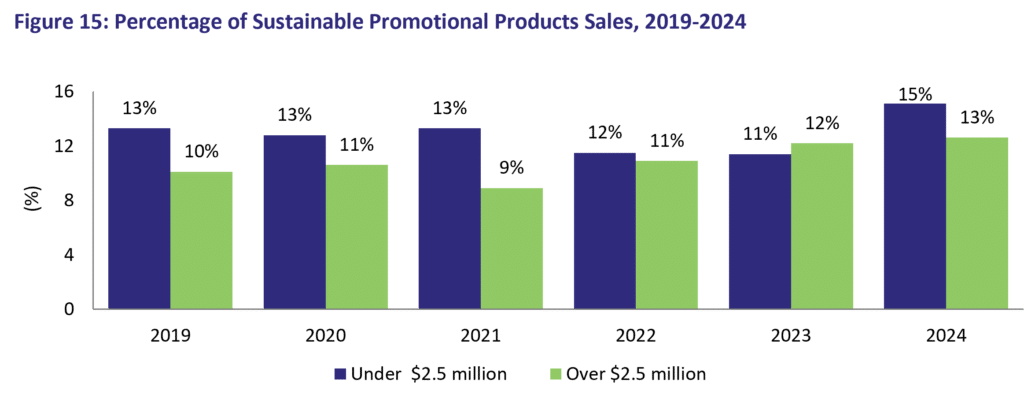
Sustainable products accounted for 13.8% of total industry sales, marking a significant 20% growth from 2023 (see Figure 15). Small distributors were the main drivers of this growth, increasing their share from 11% in 2023 to 15% in 2024. Large distributors also expanded their sustainable offerings, increasing their share from 12% to 13%.
The rapid rise in sustainable sales among smaller distributors suggests increased accessibility, wider product availability and growing demand from end buyers for eco-friendly solutions at all business levels.
Sales By Product Categories And Industries
As in previous years, apparel was the most commonly sold promotional product category (see Figure 16), making up 26.6% of sales, followed by drinkware at 10.2%. However, caps and hats overtook bags and travel for the third-place spot, rising from 7.2% in 2023 to 9% in 2024.

Education, followed by business services (B2B) and construction, ranked among the top three industries buying promotional products. This is a change from 2023, when B2B led the pack, followed by education and healthcare.
How The Study Was Conducted
PPAI’s Annual Estimate of Distributors’ Sales figures is based on an independent email/mail survey of U.S. promotional products distributors (including PPAI members and non-members) conducted from December 2024 to January 2025 by Relevant Insights, an independent market research firm.
In addition, a census of the largest firms was also undertaken. Responses projected across the entire distributor population combine sales for small distributors (under $2.5 million) and large distributor firms (over $2.5 million) to determine the total promotional products dollar volume.
Professional-tier members: Access The Full 2024 Sales Volume Report

